
Response Performance
Your Improvement Journey (NFPA 1710)
March 2026: 7:17 (90th pctile), 0:57 from NFPA 1710 target of 6:20. Focus CRR on gap tracts to close the gap.
Steady Response times stable over 3 months
Overall Response Time (90th Percentile)
Department 90th percentile
7:17
NFPA 1710 target
6:20
Tracts meeting standard
16 / 35 (83%)
Component Breakdown
Turnout Time (90th %)
1:39
NFPA 1710 turnout target
1:20
Travel Time (90th %)
5:30
NFPA 1710 travel target
4:00
Station-Level Analysis
Station Performance
Response times by station vs. NFPA targets.
| Station | 90th %ile Response | vs. NFPA Target | Calls/Mo | Medical | Fire |
|---|---|---|---|---|---|
| Demo Agency Station 7 | 8:09 | ✗ Over by 1:49 | 142 | 76 | 23 |
| Demo Agency Station 3 | 7:54 | ✗ Over by 1:34 | 147 | 81 | 26 |
| Demo Agency Station 15 | 7:24 | ✗ Over by 1:04 | 109 | 62 | 16 |
| Demo Agency Station 8 | 7:13 | ✗ Over by 0:53 | 173 | 114 | 20 |
| Demo Agency Station 11 | 7:11 | ✗ Over by 0:51 | 115 | 58 | 18 |
| Demo Agency Station 6 | 7:03 | ✗ Over by 0:43 | 173 | 106 | 17 |
| Demo Agency Station 12 | 6:56 | ✗ Over by 0:36 | 137 | 83 | 11 |
| Demo Agency Station 10 | 6:53 | ✗ Over by 0:33 | 172 | 108 | 22 |
| Demo Agency Station 14 | 6:52 | ✗ Over by 0:32 | 148 | 96 | 14 |
| Demo Agency Station 16 | 6:42 | ✗ Over by 0:22 | 156 | 97 | 16 |
| Demo Agency Station 4 | 6:35 | ✗ Over by 0:15 | 150 | 100 | 17 |
| Demo Agency Station 2 | 6:21 | Near limit | 180 | 112 | 17 |
| Demo Agency Station 1 | 6:12 | ✓ On target | 212 | 139 | 20 |
| Demo Agency Station 13 | 6:12 | ✓ On target | 199 | 127 | 15 |
| Demo Agency Station 9 | 6:06 | ✓ On target | 235 | 155 | 16 |
| Demo Agency Station 5 | 5:28 | ✓ On target | 282 | 185 | 21 |
NERIS Incident Data
Incident Volume
Call volume by incident type from your NERIS data feed. MEDICAL includes illness and injury; FIRE covers structure, vehicle, and wildland; HAZSIT covers hazmat and investigations.
Calls by Type
Medical
Illness, injury, cardiac, overdose, MVC
631
(65%)
Fire
Structure, vehicle, outside, wildland
88
(9%)
Hazardous Situation
HazMat, gas leak, CO, MVC, investigation
39
(4%)
Other
Public service, rescue, alarms, false calls
220
(22%)
7.1
Calls per 1K residents
Medical share
Incident Volume by Tract
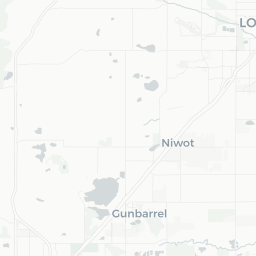

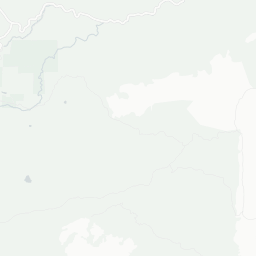
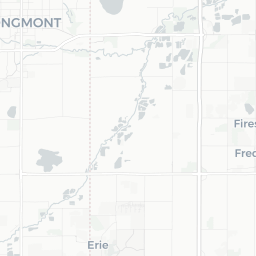


Leaflet © OSM © CARTO
All incident types by tract. Darker = more calls. Risk-response gap tracts outlined in red.
No calls
Low
Moderate
High
Risk-response gap tract
6-Month Trend Analysis
Are You Improving?
Response times, NFPA compliance, and coverage gaps over six months. Are CRR activities in risk-response gap tracts moving the needle?
90th Percentile Response (min:sec)
↑ Worsening
Changed by 0:19 over 6 months
NFPA 1710 Compliance Rate (%)
↑ Improving
Improved by 1 pts over 6 months
Risk-Response Gap Tracts
↓ Worsening
Changed by 0 tracts over 6 months
CRR Activities in Risk-Response Gap Tracts
↓ Worsening
Changed by 0 activities over 6 months
Call Volume by Type (6 months)
Medical
Fire
HazSit
Other