NFPA 1750 Response-Time Compliance
May 2026: 6:45 (90th pctile), 0:25 over your goal of 6:20. Focus CRR on elevated risk-response tracts to close the gap.
Methodology: what "total response time" means here
Your department sets its own goals; the NFPA-aligned defaults below are the starting point until you customize them in the Define elevated tracts panel.
Total response time on this dashboard is measured from NERIS call-create timestamp to first-unit on-scene timestamp. It is the dispatch-to-arrival reflex time and includes the three components below. NFPA 1750:2026 (consolidating the former NFPA 1710) sets a 90% attainment objective for each component and for the combined total. Clause numbers below carry over from the legacy NFPA 1710 document.
- Call processing / alarm handling: NFPA 1750 9.2.1 sets 64 seconds (1:04) at 90%. Measured from NERIS call-create to unit-notified. Now broken out in the Component Breakdown card.
- Turnout time: NFPA 1750 4.1.2.1.1 sets 80 seconds (1:20) at 90% for fire suppression; 60 seconds (1:00) at 90% for EMS. Measured from unit notification to en-route.
- Travel time: NFPA 1750 4.1.2.1.1 sets 240 seconds (4:00) at 90% for first-arriving engine; 480 seconds (8:00) for full first-alarm assignment. Measured from en-route to on-scene.
The 6:20 default total response goal reflects 1:04 call processing + 1:20 turnout + 4:00 travel. Some agencies report response time as turnout + travel only (5:20); we use the dispatch-to-arrival convention because it is what residents actually experience and what NERIS records.
Mutual aid / auto-aid handling: detailed inclusion rules for incoming and outgoing aid responses are documented separately. See full methodology.
Overall Response Time (90th Percentile)
Component Breakdown
NFPA-aligned defaults: 1:04 call processing, 1:20 fire turnout (1:00 EMS), 4:00 travel. Edit your goals from the Define elevated tracts panel below.
Station Performance
Per-station 90th-percentile times by response component. The columns show whether a slow station's bottleneck is dispatch (call processing), the crew (turnout), or distance (travel). Cells color green / amber / red against your goal for that component (NFPA defaults: 1:04 call processing, 1:20 fire turnout / 1:00 EMS turnout, 4:00 travel). Cells with fewer than 10 calls in the period show a dash.
| Station | Call Processing | Fire Turnout | EMS Turnout | Travel | Calls/Mo | Medical | Fire |
|---|---|---|---|---|---|---|---|
| Demo Agency Station 3 | 1:17 | 1:34 | 1:20 | 4:37 | 134 | 73 | 18 |
| Demo Agency Station 4 | 1:21 | 1:47 | 1:23 | 3:52 | 153 | 96 | 14 |
| Demo Agency Station 6 | 1:15 | 1:32 | 1:19 | 3:50 | 153 | 101 | 19 |
| Demo Agency Station 2 | 1:12 | 1:31 | 1:06 | 3:41 | 199 | 123 | 25 |
| Demo Agency Station 1 | 0:57 | 1:15 | 1:08 | 2:40 | 252 | 178 | 22 |
| Demo Agency Station 5 | 1:03 | 1:19 | 0:58 | 2:58 | 282 | 181 | 31 |
Incident Volume (May 2026)
Call volume by incident type from your NERIS data feed for the latest reporting month. For 6-month trends see Call Mix below. MEDICAL includes illness and injury; FIRE covers structure, vehicle, and wildland; HAZSIT covers hazmat and investigations.
Calls by Type (this month)
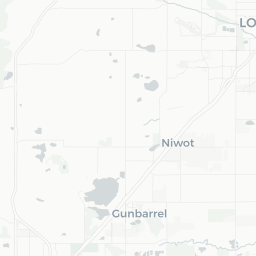
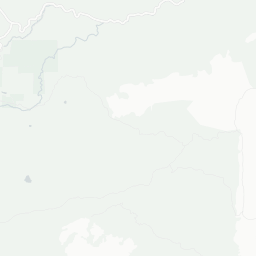
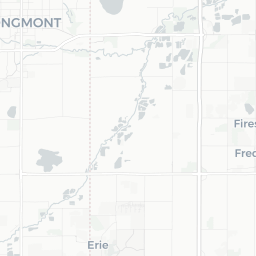
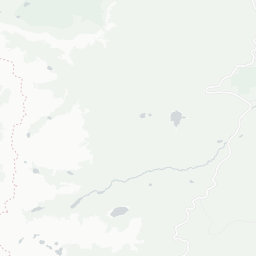
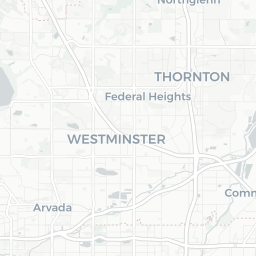
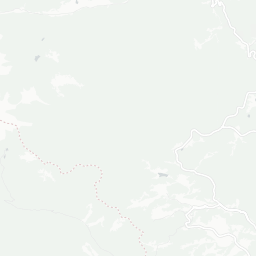
Incident Volume by Tract
All incident types by tract. Darker = more calls. Elevated risk-response tracts outlined in red.
Your Call Load Over Time
How call volume and type-mix have shifted. Headline metrics and 6-month trend lines for response, compliance, gaps, and CRR sit in the top metric cards above.